Campaign research | September 29, 2026

Taxes and household income

Owen Sound residents deserve a budget that reflects what local households can afford. This page brings the Census income points and the published property-tax figures into one readable record.

Campaign website Candidate plan Debate information

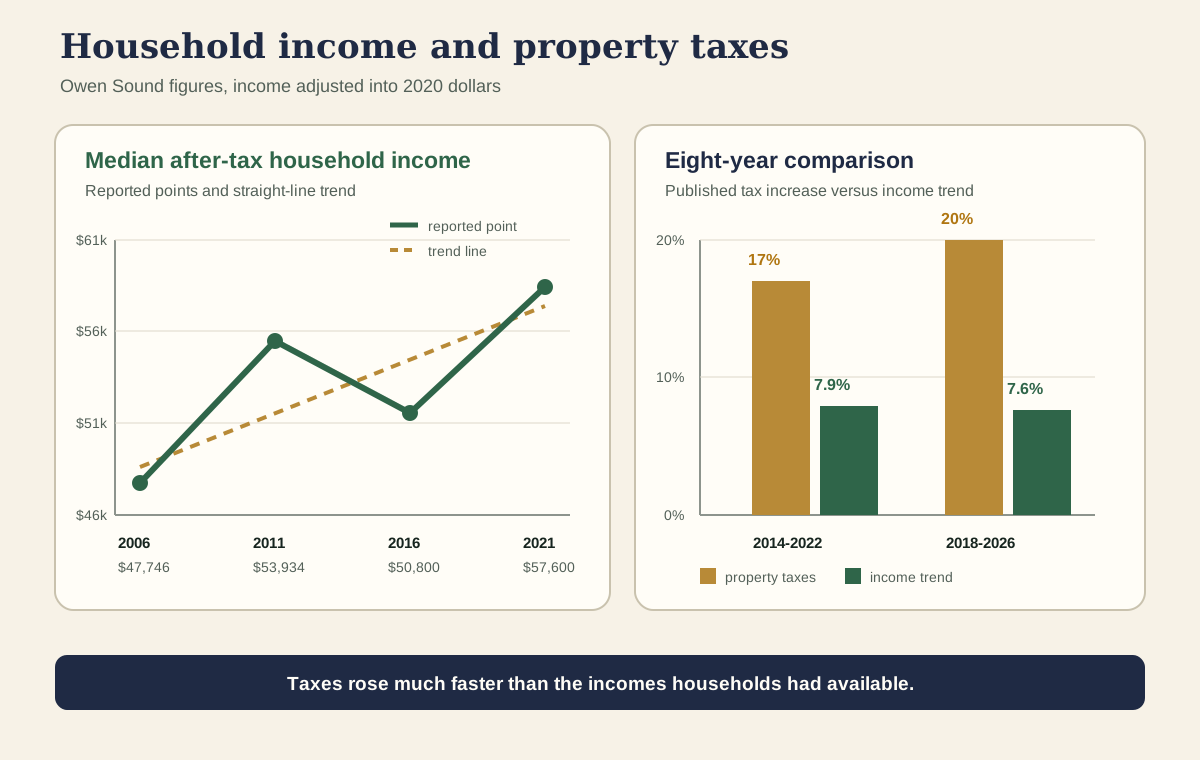
The comparison: after adjusting for inflation, median after-tax household income grew 7.9% over the 2014-2022 trend period and 7.6% over the 2018-2026 trend period. Property taxes rose 17% during Richard Thomas's eight years and 20% during Carol Merton's.

That means taxes rose 2.1 times as much as the income trend during Thomas's period and 2.6 times as much during Merton's. The gaps were 9.1 and 12.4 percentage points, respectively. Future budgets should connect the tax burden to household affordability and publish the evidence each year.

Four inflation-adjusted median after-tax household-income points from 2006 to 2021 with a straight-line trend, alongside bars showing 17 percent property-tax growth versus 7.9 percent income trend from 2014 to 2022 and 20 percent property-tax growth versus 7.6 percent income trend from 2018 to 2026.

Sentence for the debate

“After adjusting for inflation, median after-tax household income grew 7.9% over the 2014-2022 trend period and 7.6% over the 2018-2026 trend period. Property taxes rose 17% during Richard Thomas's eight years and 20% during Carol Merton's. That means taxes rose 2.1 times as much as the income trend during Thomas's period and 2.6 times as much during Merton's. The gaps were 9.1 and 12.4 percentage points, respectively.”

Income trend

The line uses median after-tax household income, converted into 2020 dollars:

2006: $47,746
2011: $53,934
2016: $50,800
2021: $57,600

The 2011 point comes from the National Household Survey because the 2011 Census did not collect income data.

Property-tax comparison

The tax figures are the published campaign calculations for the two eight-year Council periods:

2014-2022: taxes 17%, income trend 7.9%
2018-2026: taxes 20%, income trend 7.6%

The difference is 9.1 percentage points in the first period and 12.4 in the second.
Important context

The 2020 income point includes pandemic income supports. Statistics Canada says those supports were a major reason after-tax incomes rose in 2020. The comparison therefore gives the previous councils a favourable income trend.

The income line is a trend estimate, not a claim that every household earned the median. The tax figures describe the municipal property-tax burden; they do not include Grey County or provincial education levies.

Source table

ProductIncome yearReported income2020 dollarsSource
2006 Census2005$37,291$47,746Statistics Canada
2011 NHS2010$45,864$53,934Statistics Canada
2016 Census2015$46,857$50,800Statistics Canada
2021 Census2020$57,600$57,600Statistics Canada

Detailed records